Monitor NGINX Performance With Google Cloud Ops (Formerly Stackdriver)
Get insights into your app's performance by monitoring your NGINX instance using GCP Monitoring
Monitoring nginx performance can help you understand what the underlying application is doing. Monitoring is also an essential part of maintaining an app's operation. Proper monitoring and alerting system can help you diagnose bugs, identify attacks, or get the gists of your apps load.
Installing Cloud Ops Agent
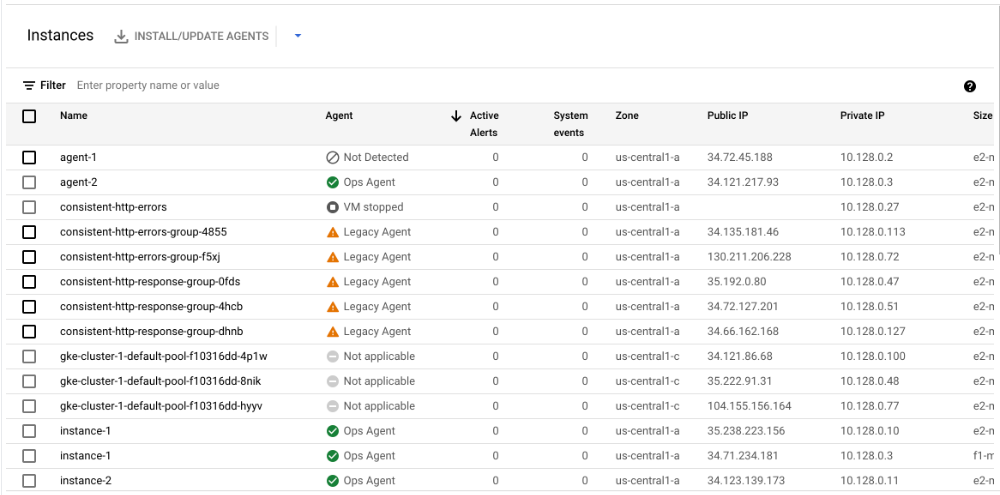
Before we start, make sure you have installed cloud ops agent on your machine. It's not installed by default, even in your google cloud compute engine machine, so we must install the agent first.
Run this command on a dir you can access
curl -sSO https://dl.google.com/cloudagents/add-google-cloud-ops-agent-repo.sh
sudo bash add-google-cloud-ops-agent-repo.sh --also-install
That's it. You can check if the ops agent is running by using
sudo systemctl status google-cloud-ops-agent"*"You can also install the ops agent using google cloud console.
This is useful, especially if you try to install the ops agent on multiple machines.
Configuring NGINX stub-status Module
For ops agent to ingest the statistics of your nginx instances, it will use the stub-status module from nginx. Every standard installation of nginx will include the module. However, if you build nginx from the source, you need to rebuild it with the module included.
To enable the module, you need to write the module config into a location block. You can add the block to an existing server configuration.
location /status {
    stub_status on;
    access_log off;
    allow 127.0.0.1;
    deny all;
}
For example, I will add the above configuration to an existing site config.
server {
        listen 80 default_server;
        listen [::]:80 default_server;

        root /var/www/html;

        access_log /var/log/nginx/site.access_log;

        error_log /var/log/nginx/site.error_log info;

        # Add index.php to the list if you are using PHP
        index index.php index.html index.htm index.nginx-debian.html;

        server_name _;

        location / {
                # First attempt to serve request as file, then
                # as directory, then fall back to displaying a 404.
                try_files $uri $uri/ =404;
        }

        location ~ [^/]\.php(/|$) {
                fastcgi_split_path_info  ^(.+\.php)(/.+)$;
                fastcgi_index            index.php;
                fastcgi_pass unix:/var/run/php/php7.4-fpm.sock;
                include fastcgi_params;
                fastcgi_param   PATH_INFO  $fastcgi_path_info;
                fastcgi_param   SCRIPT_FILENAME $document_root$fastcgi_script_name;
        }

        location /status {
                stub_status on;
                access_log off;
                allow 127.0.0.1;
                deny all;
        }
}
Let me explain the configuration.
- First, we will enable the
stub_statusThis will enable the module - Next, we turn off
access_logcollection for the specificstatuslocation to prevent the log building up, as the ops agent will regularly access the status module regularly - Finally, we only allow
localhostaccess to the module.
Now, reload your nginx
sudo systemctl reload nginxNow, test the module by curl-ing into the URL
curl http://127.0.0.1:80/statusIf you get this response, then it is a success.
Active connections: 1
server accepts handled requests
 23 23 74
Reading: 0 Writing: 1 Waiting: 0
Configuring the Ops Agent
We need to configure the ops agent to start ingesting the nginx statistics and logs. Open /etc/google-cloud-ops-agent/config.yaml with your favourite editor and paste this comment.
logging:
  receivers:
    # Configure Error Log Ingesting
    nginx_error:
      type: nginx_error
      # Point this to your site's error log
      include_paths: [/var/log/nginx/site.error_log]
    # nginx_access:
       # type: nginx_access
       # include_paths: [/var/log/nginx/site.access_log]
  service:
    pipelines:
      nginx:
        receivers:
          - nginx_error
          # - nginx_access
# Configure nginx metrics ingesting
metrics:
  receivers:
    nginx:
      type: nginx
      stub_status_url: http://127.0.0.1:80/status
  service:
    pipelines:
      nginx:
        receivers:
          - nginx
You can also ingest access log (the required config is in the commented code), but I highly do not recommend it because the log size will get huge and incur more log billing.
Now, restart your cloud ops agent.
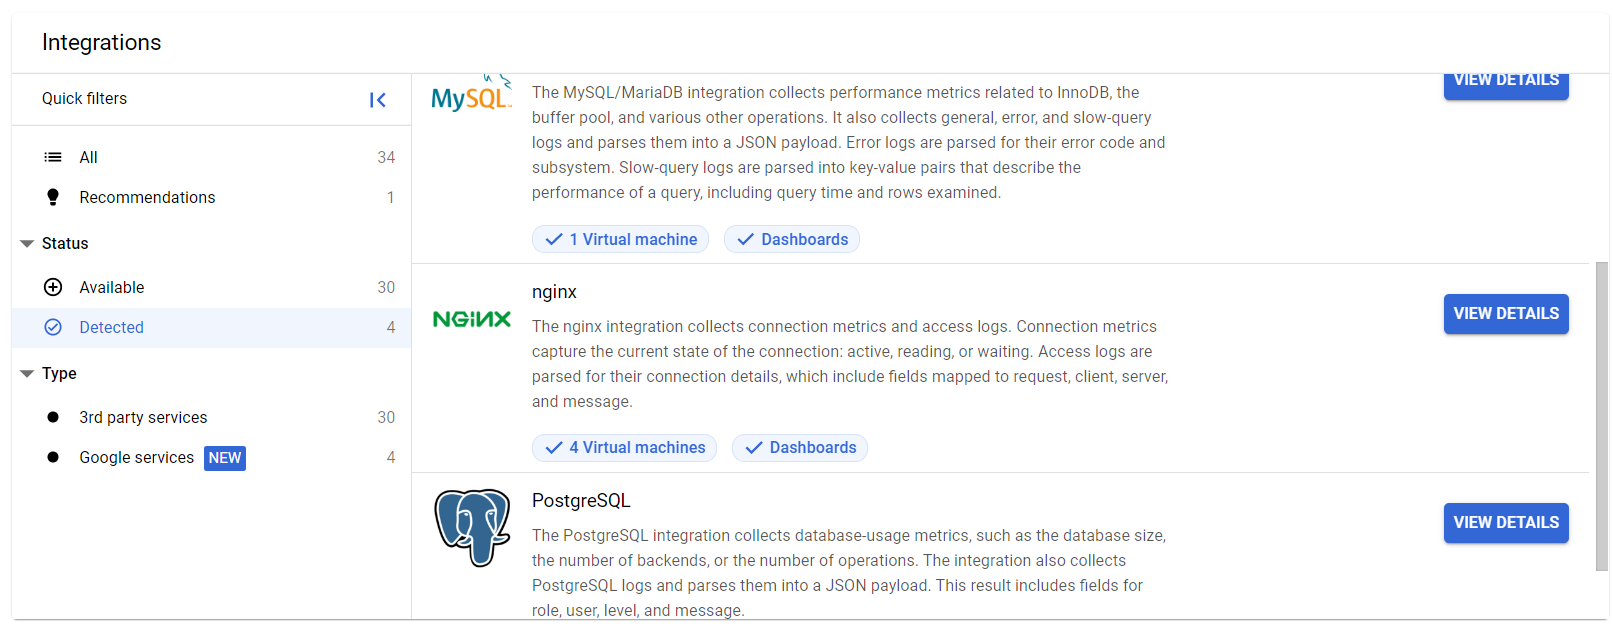
sudo systemctl restart google-cloud-ops-agentAfter that, go to your monitoring page and click Integration.
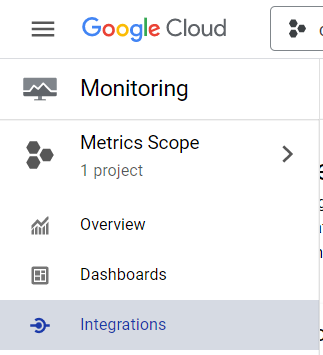
It may take a few minutes. Otherwise, it will appear on the integration page.
Now you can view your nginx monitoring dashboard. Here is the example of the graph for our NGINX instances
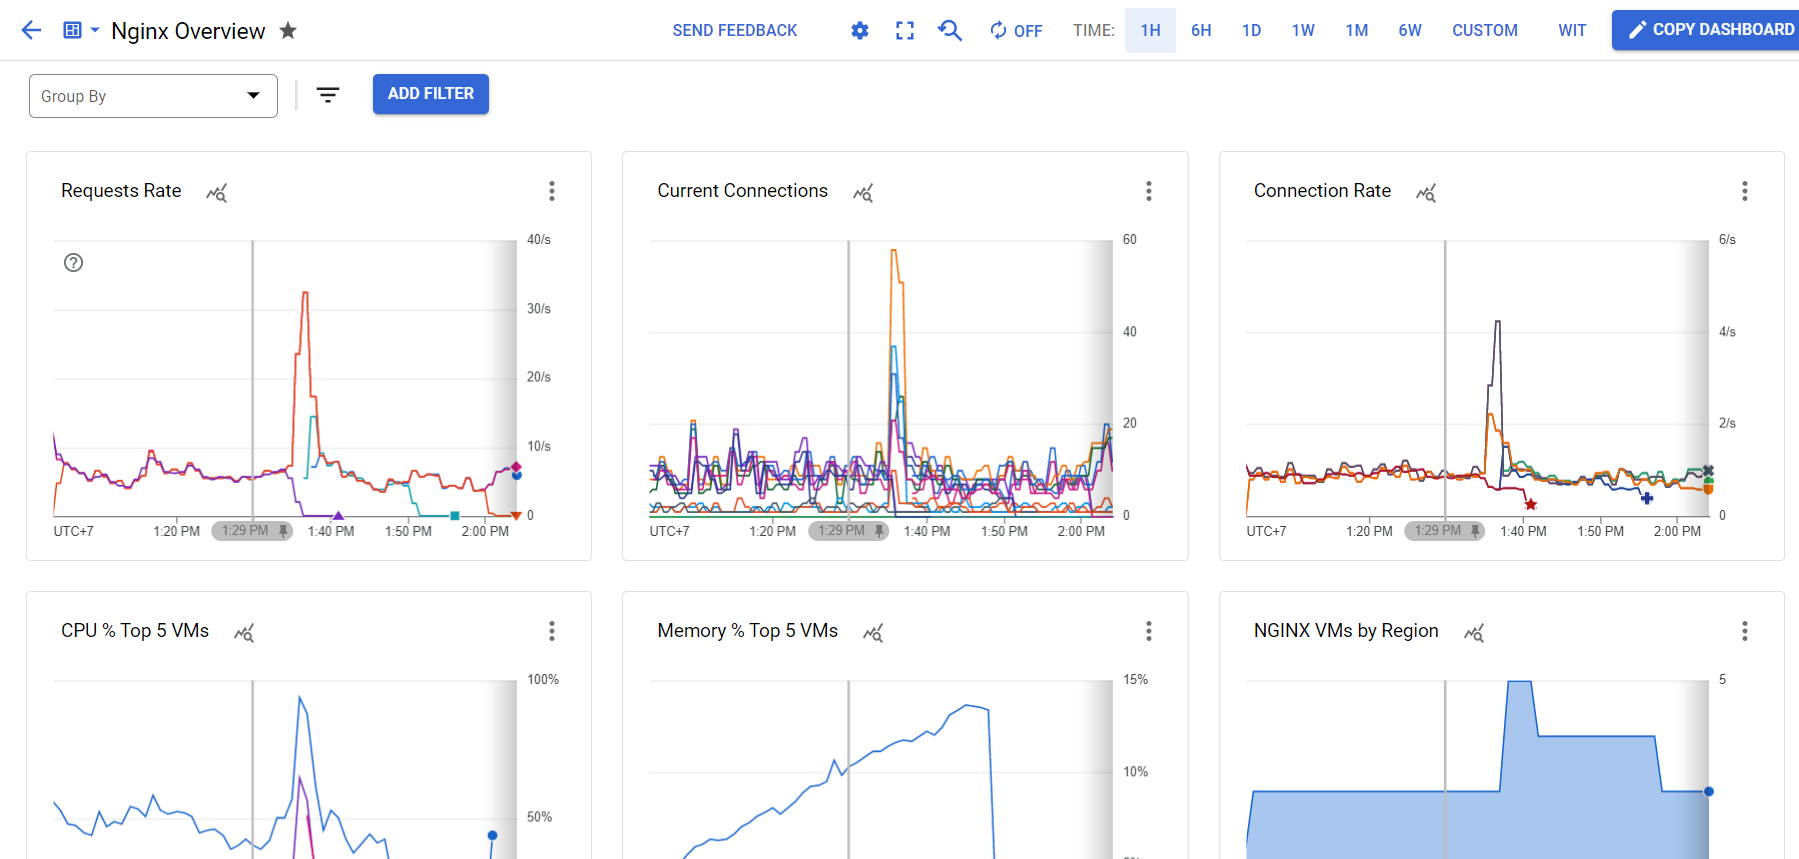
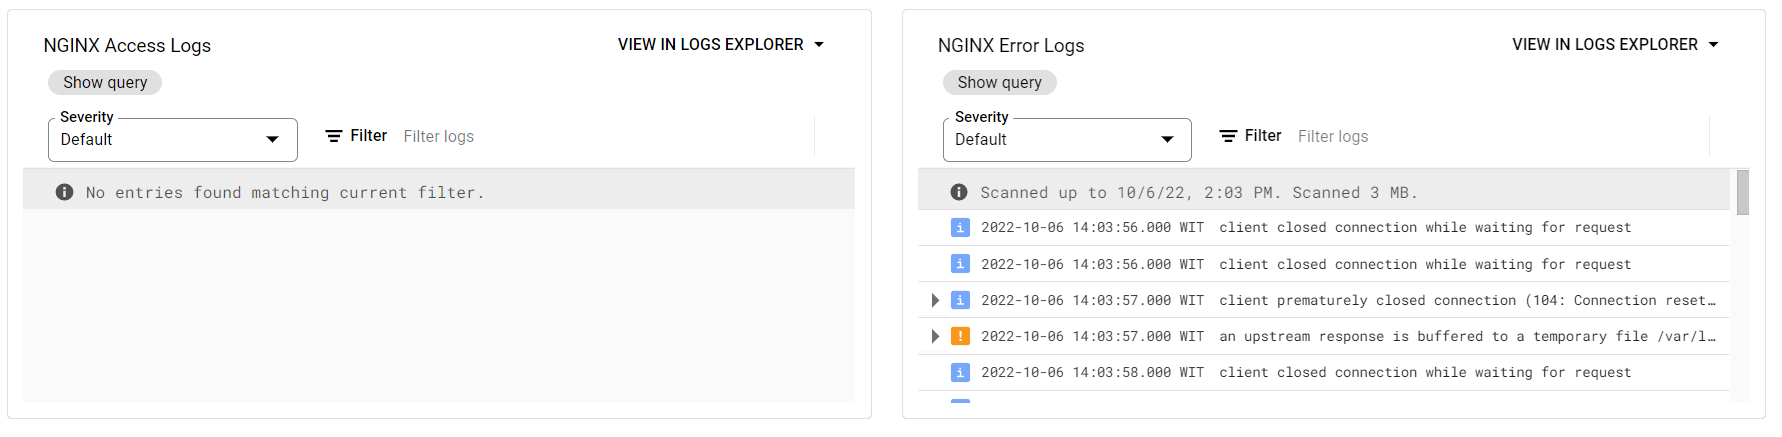
You can even view your access & error logs directly in the monitoring dashboard.
Thank you for reading my article! That was an easy one! If you have any questions regarding monitoring and google cloud things, contact me at [email protected].